Becton Dickinson
Interactive Data Visualizations
Challenge
In preparation for crafting a new brand story at medical technology company Becton Dickinson, our team posed a series of questions around internal brand perception to key stakeholders at the company. The resulting data was dense and unnavigable, so we needed a way to present the findings back to the client in an engaging and digestible format.
design director: Christian Linsey, Lead designer: William conklin,
Senior Researcher: Valentina cANAVESIO, Senior UX designer: Jen zhao, Senior digital designer: Sarah knotz

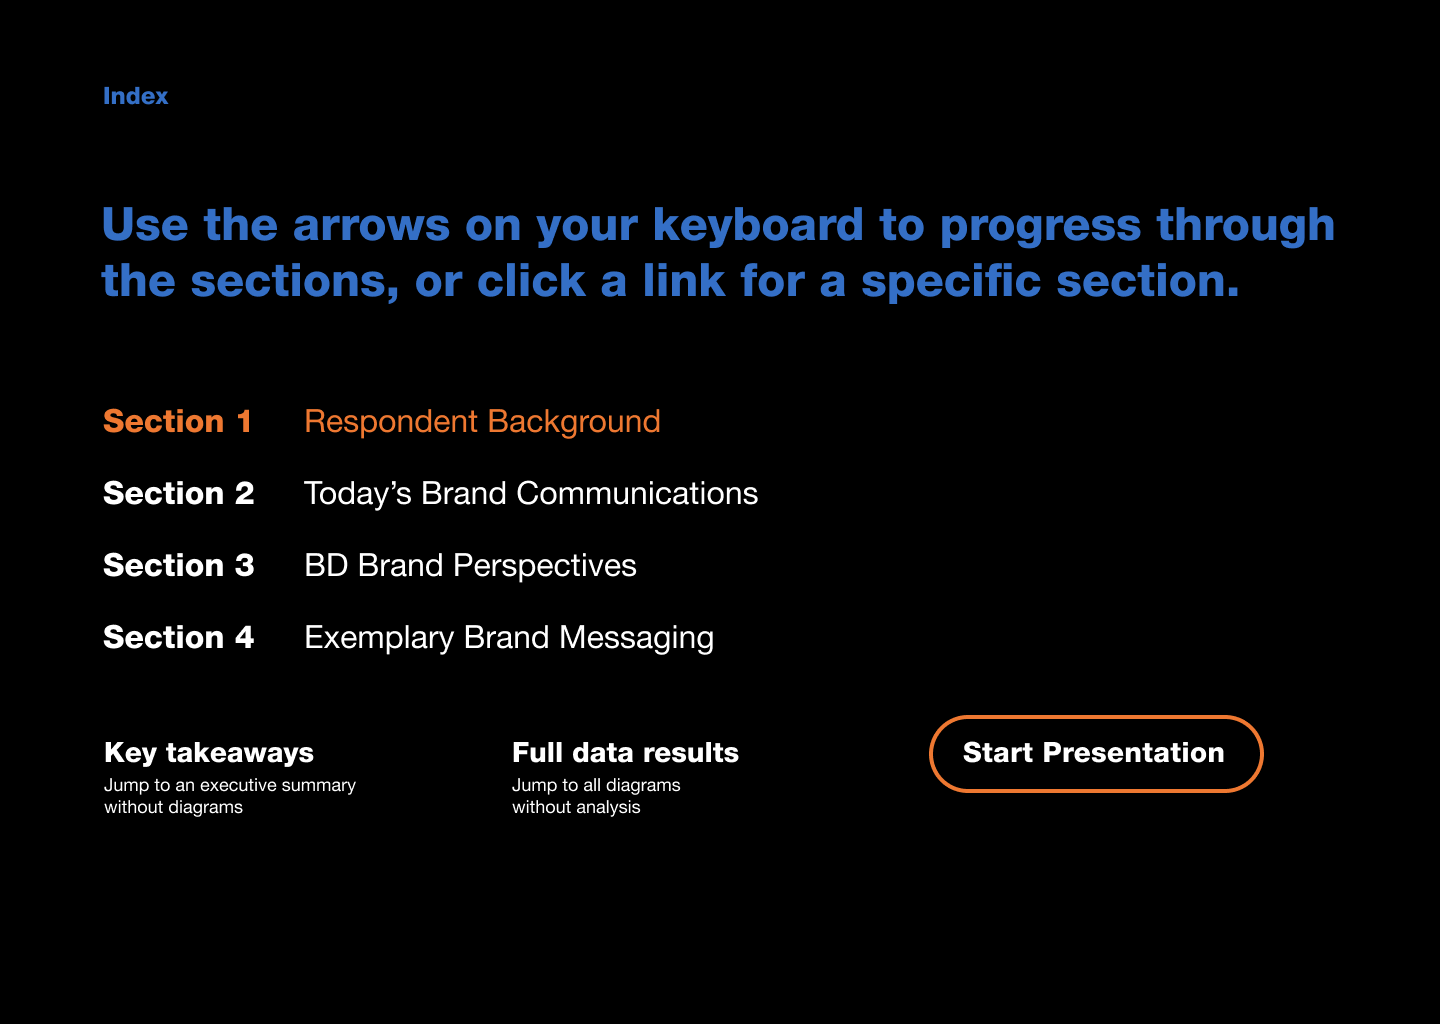
The solution took the form of an interactive presentation divided into sections around question themes.
The format was designed with the option to be presented alongside live analysis by our team for an audience, or browsed independently by client team members for deeper review.